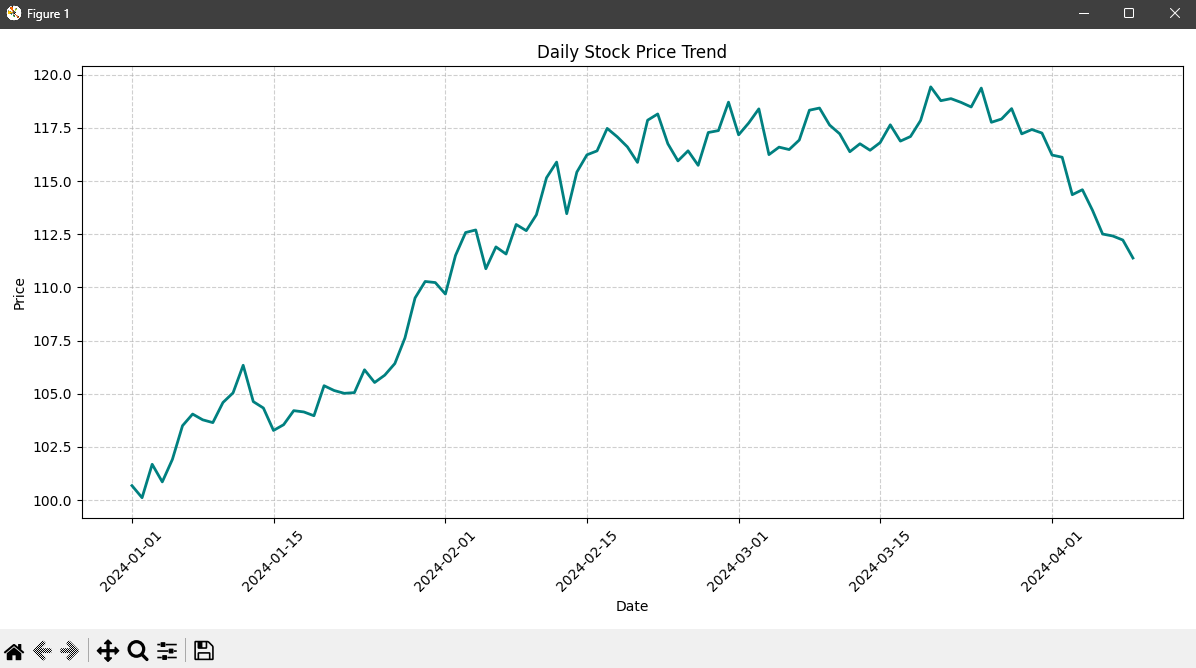
📈 Line Plot Time Series
Tracks daily stock prices over time
Matplotlib
.
← Back to Projects
View on GitHub
📜 Code
📜 Sample Output