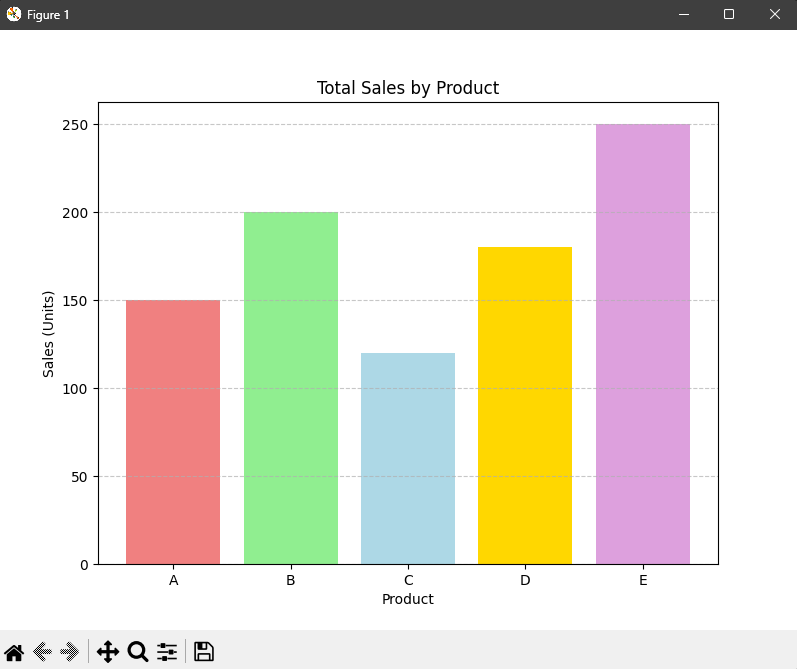
📈 Bar Chart
Compares sales quantities across product categories.
Matplotlib
.
← Back to Projects
View on GitHub
📜 Code
📜 Sample Output