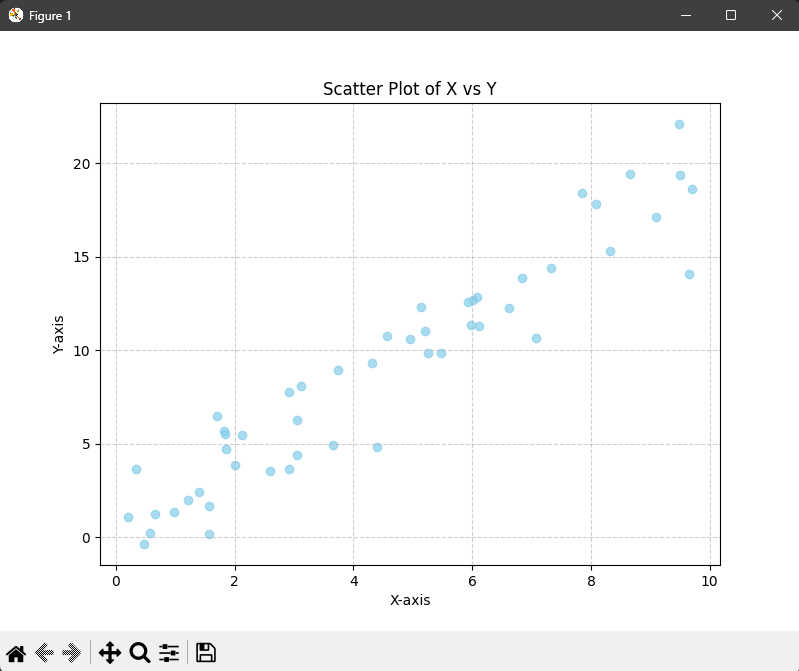
📈 Scatter Plot
Visualizes correlation between two continuous variables using
Matplotlib
.
← Back to Projects
View on GitHub
📜 Code
📜 Sample Output